Usage analytics
See How AI Is Actually Used Across Your Company
Understand who uses AI, which models they choose, what projects consume budget and where adoption is creating value.
- Tokens and cost by user, model, project and vendor
- Filter by vendor, model, user, key source and period
- Built for founders, operations, IT and finance
The problem
Most companies cannot describe their own AI usage
AI adoption usually happens bottom-up. By the time leadership asks how it is going, the evidence is scattered across personal accounts nobody can see into.
Adoption is anecdotal
You know AI is being used because people mention it in meetings. You cannot say how many people, how often, or for what kind of work.
Provider dashboards do not help
A provider can show you what a key consumed. It cannot show you which employee, project or client that consumption belonged to.
Expensive habits stay hidden
A workflow that quietly runs a premium model over long documents every morning looks the same as everything else until someone reads the invoice.
Budget planning is guesswork
Without a usage trend, next year's AI budget is headcount multiplied by a subscription price and a hopeful margin.
The solution
One reporting layer over all company AI work
Because every conversation runs through the workspace, usage is measured as a by-product of the work itself. Nothing needs to be self-reported.
Usage by employee
See consumption per person, which makes both heavy users and dormant accounts obvious.
Usage by model
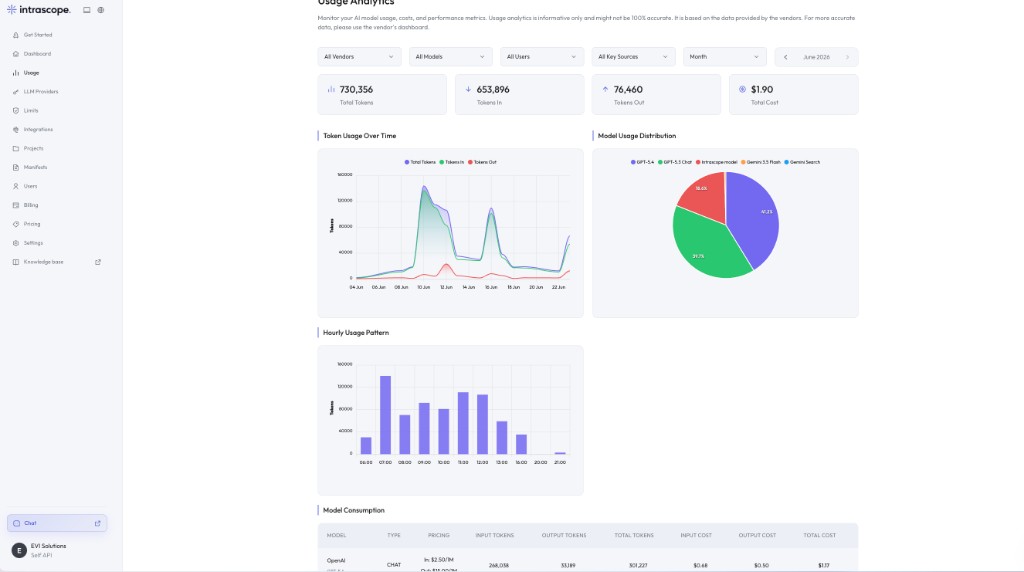
The model distribution chart shows which models absorb your tokens, and the consumption table lists input and output cost per model.
Usage by project
Projects tie usage to a client, campaign or department, so cost can be reviewed against the work that generated it.
Trends over time
Token usage over time and hourly usage patterns show whether adoption is growing, spiking or stalling.
Filters that answer real questions
Filter by vendor, model, user, key source and month to isolate exactly the slice you are being asked about.
Tokens and cost together
Total tokens, tokens in, tokens out and total cost sit side by side, so volume and price are never confused.
Walk through the analytics with your own questions
Bring the report you are being asked to produce and we will show you where it comes from in the workspace.
How it works
From no visibility to a monthly review
Reporting starts working the moment your team starts working. There is nothing to instrument.
- 01
Move the work into the workspace
Once conversations happen in projects rather than personal accounts, usage data exists by default.
- 02
Structure it by project
Create projects for the clients, departments or initiatives you will want to report on later.
- 03
Review the first full month
Look at cost by model and by user. Most teams find one expensive default and two accounts that never signed in.
- 04
Act on it
Move routine work to lighter models, cap the expensive ones, and reallocate access to the people who are actually using it.
Inside the product
The reports leadership asks for
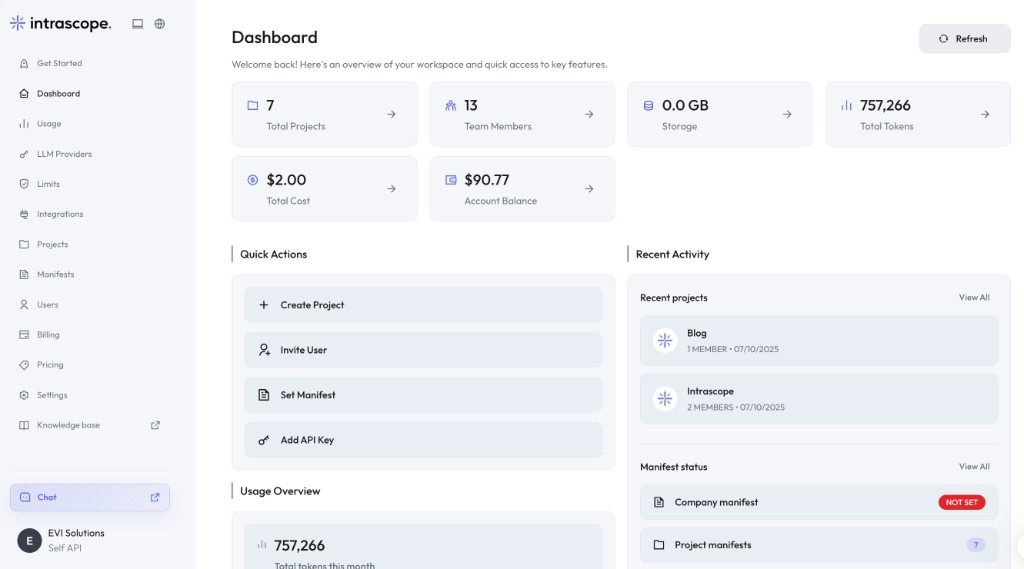
Everything below comes from the shipped analytics and dashboard screens.
Total Tokens
732,356
Total Cost
$1.92
Token Usage Over Time
Model Mix
Hourly Usage Pattern
Business outcome
Decisions this data makes possible
Identify unused access
Accounts with no consumption are visible immediately, which turns renewal decisions into a matter of record.
Find expensive workflows
When one project or model dominates the chart, you can look at the work behind it and decide whether it is worth the price.
Understand adoption by team
See whether AI use is concentrated in one department or spreading, and where enablement is still needed.
Improve model allocation
Match model tiers to task types with evidence instead of preference.
Plan the AI budget
Build next year's number on a measured trend rather than a seat count.
Report upward with confidence
Give the board, the CFO or the client a defensible answer about how AI is being used.
Before and after
What you can answer, before and after
The same five questions, asked of a company on personal accounts and a company on a shared workspace.
| Topic | Personal accounts | Intrascope workspace |
|---|---|---|
| How many people use AI weekly? | An estimate based on who mentions it. | A number, per user, for the period you select. |
| Which model costs us most? | Unknown until the provider invoice arrives. | Visible in the model distribution and consumption table. |
| Which client work uses AI? | Not tracked anywhere. | Usage grouped by the project that produced it. |
| Is adoption growing? | Impossible to say without a baseline. | Token usage over time, per month. |
| Are we paying for idle access? | Probably, but nobody can prove it. | Users with no consumption appear in the breakdown. |
| Where should we invest next? | Whoever argues loudest. | The teams and workflows where usage and outcomes are real. |
How many people use AI weekly?
Personal accounts
An estimate based on who mentions it.
Intrascope workspace
A number, per user, for the period you select.
Which model costs us most?
Personal accounts
Unknown until the provider invoice arrives.
Intrascope workspace
Visible in the model distribution and consumption table.
Which client work uses AI?
Personal accounts
Not tracked anywhere.
Intrascope workspace
Usage grouped by the project that produced it.
Is adoption growing?
Personal accounts
Impossible to say without a baseline.
Intrascope workspace
Token usage over time, per month.
Are we paying for idle access?
Personal accounts
Probably, but nobody can prove it.
Intrascope workspace
Users with no consumption appear in the breakdown.
Where should we invest next?
Personal accounts
Whoever argues loudest.
Intrascope workspace
The teams and workflows where usage and outcomes are real.
Who uses this
The people who open the analytics screen
Usage analytics is usually the reason an admin logs in, even on days when they do not use the chat at all.
Founders reviewing adoption
A monthly look at which teams use AI and whether that matches where the company said it wanted leverage.
Operations leaders standardizing workflows
Find the workflows that run every day, then turn the good ones into shared projects and manifests.
IT managers auditing access
Check which vendors and models are reachable, who is using them and whether anyone still has access they should not.
Finance leaders forecasting spend
Take the token and cost trend into the budget conversation instead of a per-seat estimate.
Team administrators managing seats
See who has never signed in, reassign access to people on the waiting list and keep the plan's user allowance productive.
FAQ
Questions teams ask before they switch
Total tokens, tokens in, tokens out and total cost, broken down by user, project, vendor and model, with token usage over time and hourly usage patterns for the selected period.
Yes. The usage screen filters by vendor, model, user, key source and month, so you can isolate one team, one provider or one billing source.
Yes. Usage is recorded for both your own provider keys and Intrascope-managed usage, and key source is one of the available filters.
Usage analytics reports on volume and cost, not on the text of individual chats. Project membership controls who can see the work itself.
Costs are calculated from provider pricing and the tokens consumed, and the screen notes that figures are indicative and based on data provided by the vendors. For billing-grade numbers, your provider dashboard remains the source of record.
Usage is recorded as your team works, so the dashboard reflects activity in the current period rather than waiting for a monthly close.
No. Analytics come from the work itself. Creating projects for your clients or departments simply makes the breakdowns more useful.
Explore the rest of the platform
Learn more
Ready to bring company AI usage under control?
Replace estimates about company AI usage with a dashboard that shows who used which model, on what work, at what cost.
7-day free trial · No credit card required